 The Wonder of Baker Mayfield: A Stats Look Through 10 Games
Posted on: November 16, 2017
The Wonder of Baker Mayfield: A Stats Look Through 10 Games
Posted on: November 16, 2017
All stats and records are pulled from https://www.sports-reference.com/cfb/
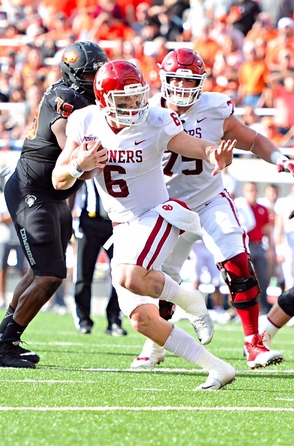
Baker Mayfield is tearing through college football. Week in and week out, he proves critics wrong. His journey is well-documented: two time walk-on, beating out previous starter Trevor Knight, Heisman finalist twice, countless plays that looked like magic acts, efficiency through the roof, etc. As he progresses through his college journey, he continues to impress fans and scouts alike; even those most outspoken about Mayfield’s NFL chances are coming around.
One reason Mayfield’s current season is so impressive is that, as good as his first two seasons in Norman were, this one has perhaps been even better.
Here is a comparison of Baker’s current season against his previous two with the Sooners.
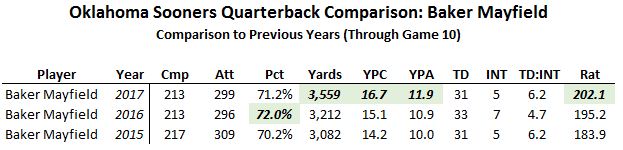
Bests in a category are highlighted
First of all, let’s not ignore the consistency in some of those numbers. The exact same number of completions through ten games in two years? The same number of touchdowns and interceptions through ten games in both 2017 and 2015? Wow.
Let’s look at some of the differences from previous years. The completion percentage is right on track with previous years, as are the touchdown and interception numbers.
One big change is in the yardage: 300 more yards than last year. As a result, the YPC and YPA numbers have seen huge jumps. Last year, Baker finished the season with an 11.08 YPA line; that number was good for second all time (Michael Vick holds the record from 1999 at 11.35). His 11.90 would be a huge jump from that. There have only been three seasons with a YPA number over 11.0 – Baker could have two of the potential four if he finishes above that mark.
Finally, the passer rating. Last year, Mayfield broke the single season passing efficiency rating by almost five points; he’s beating that mark by almost six points this year. That would be a truly remarkable finish.
But wait, you say. That’s nice and all, but how does he stack up against other OU quarterbacks?
Well, I had the same thought. Here are those same stats against recent OU quarterbacks. Quarterbacks who threw the ball with a higher frequency were chosen to create more relevant comparisons, and the best statistical years of those quarterbacks were chosen.
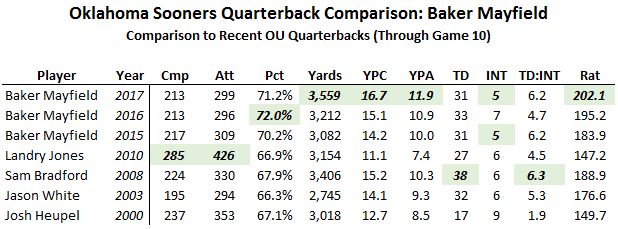
As shown above, Mayfield holds up very well against previous Sooner quarterbacks. (Also, Good Lord did Landry Jones throw the ball a lot).
But wait, you say. That’s nice and all, but what about quarterbacks not from OU? How does he match up against Heisman level talent?
Well, I had the same thought. Below is a comparison of Baker Mayfield this year against all Heisman-winning quarterbacks from the past fifteen years.
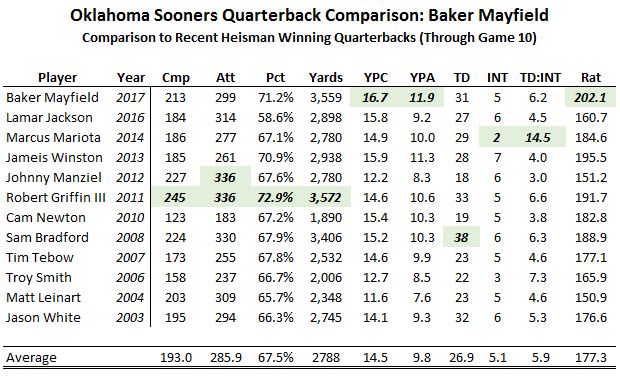
Mayfield matches up like a champ against those numbers. He doesn’t throw the ball as often as some (thank you very much to Rodney Anderson, Trey Sermon, Abdul Adams, and company for that). As such, his completions, attempts, and touchdown numbers aren’t quite as high as some of the others. When he does throw, however, his efficiency is through the roof.
Completion percentage? 2nd highest on the list
Yards? 2nd highest on the list
YPC? Highest (by a lot)
YPA? Highest
Passer rating? Highest (by a good bit)
What Baker Mayfield is doing right now is special Sooner fans. Appreciate it. Because there are a limited number of these plays remaining in an Oklahoma jersey.
https://twitter.com/TFB_Sooners/status/929549766891069440